This tutorial discusses advanced use of virt-df. Some of the topics covered are:
If you are going to do anything apart from looking at the output of
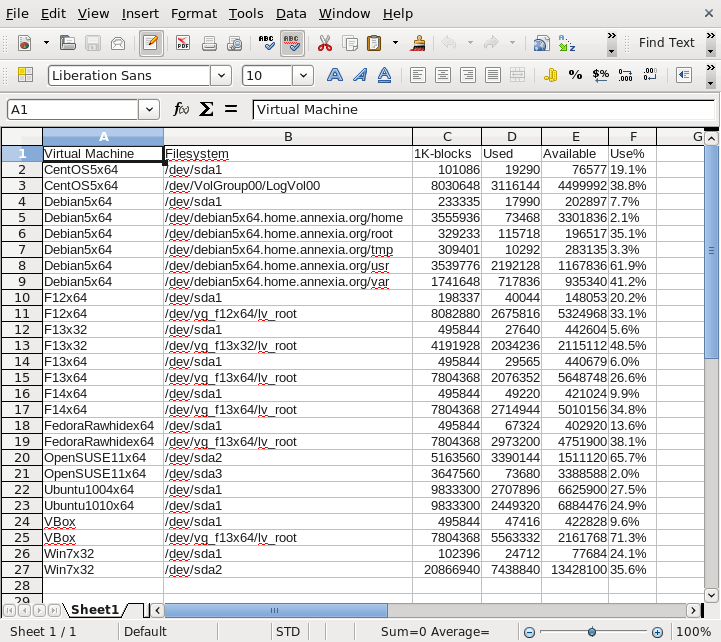
virt-df, you should use the --csv flag so that virt-df
produces machine-readable
comma-separated
values (CSV) output. The output looks like this:
# virt-df --csv
Virtual Machine,Filesystem,1K-blocks,Used,Available,Use%
"CentOS5x64","/dev/sda1",101086,19290,76577,19.1%
"CentOS5x64","/dev/VolGroup00/LogVol00",8030648,3116144,4499992,38.8%
[etc]
[% END %] [% WRAPPER h2 h2="Using cron" anchor="cron" %]
You can write a cron job to collect virt-df output periodically (I collect it once a day).
# cat > /etc/cron.daily/local-virt-df
#!/bin/bash -
date=$(date +%F)
virt-df --csv > /var/local/virt-df.$date
# chmod 0755 /etc/cron.daily/local-virt-df
The cron job will create one file every day in /var/local.
CSV files can be loaded directly into spreadsheets and databases:
CREATE TABLE df_data (
  "Virtual Machine" TEXT NOT NULL,
  "Filesystem" TEXT NOT NULL,
  "1K-blocks" BIGINT NOT NULL,
  "Used" BIGINT NOT NULL,
  "Available" BIGINT NOT NULL,
  "Use%" TEXT
);
COPY df_data FROM 'df.csv' WITH DELIMITER ',' CSV HEADER;
[% END %] [% WRAPPER h2 h2="Sorting and querying the data" anchor="query" %]
Once your data has been imported, you can start to process it, for example finding out which virtual machines are running out of space:
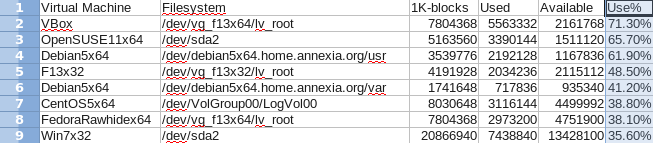
The following PostgreSQL query on the previously imported data shows all filesystems with over 60% usage:
SELECT "Virtual Machine", "Filesystem"
  FROM df_data
 WHERE (100. * "Used" / "1K-blocks") > 60;

 Virtual Machine |              Filesystem
-----------------+--------------------------------------
 Debian5x64      | /dev/debian5x64.home.annexia.org/usr
 OpenSUSE11x64   | /dev/sda2
 VBox            | /dev/vg_f13x64/lv_root
(3 rows)
[% END %] [% WRAPPER h2 h2="Graphs and trends" anchor="graphs" %]
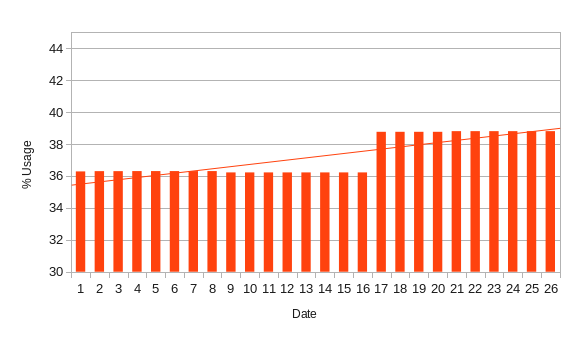
You can use daily historical data to graph disk usage.
In theory at least you could use trends in this data
to predict future requirements, although in my experience
usage tends to be lumpy
— installing OpenOffice
in a VM results in a big increase in usage which is not
indicative of any trend.
In any case, here is a graph of usage data for one VM filesystem over approximately one month, generated using OpenOffice Calc (Insert → Chart) with a linear trend line (select chart and do Insert → Trend Lines):
virt-df is generally safe to use with untrusted or malicious guests, but there are some things to be aware of.
An untrusted guest can present any disk data that it wants to the host. By simple manipulations of the filesystem it can show the disk as full when it is empty, or empty when it is full. This is not important in itself, it only becomes an issue if a guest could manipulate the statistics of another unrelated VM.
Older versions of virt-df ran a separate libguestfs appliance for each guest. This is safe because one guest cannot possibly interfere with the statistics from another, but also slow. Since virt-df 1.5.0, several unrelated guests may share a single libguestfs appliance, which is much faster but there is a (slim) possibility that one guest might corrupt the appliance leading to misreported statistics for another guest.
You can get the old, safest possible behaviour by adding
the --one-per-guest flag to the virt-df command line.